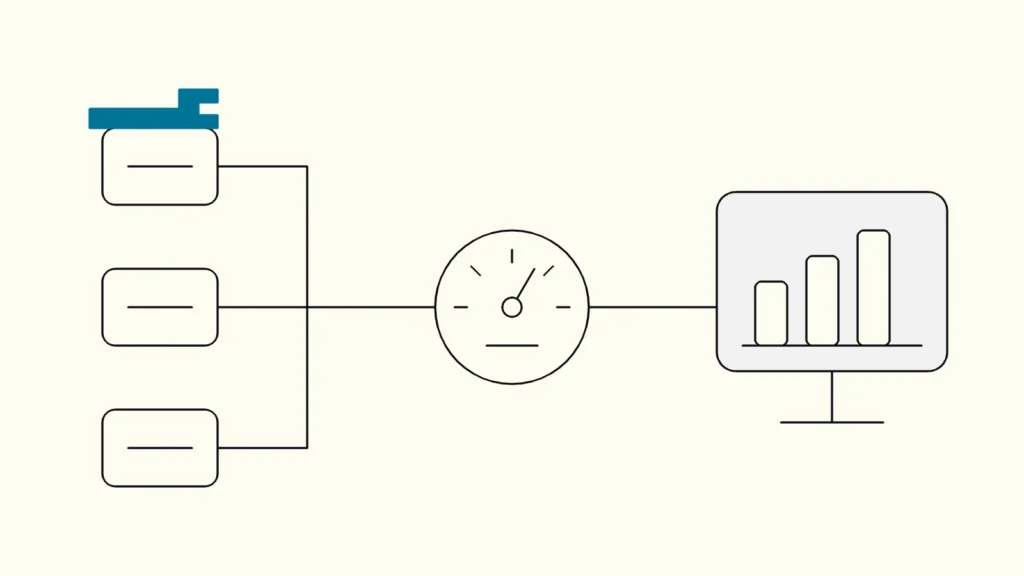
A seven-step method for turning complaints about bad data into measured quality rules, automated checks and fixes in the systems where errors begin.
In short
Data quality is how well data fits the use it is meant for. Measure it with a few dimensions, such as completeness, validity, uniqueness, consistency and timeliness, written as testable rules on the data that matters most. Automate the checks in your pipelines, publish the scores, and fix errors in the source system and process, not only in the report.
Every data project eventually hits the same wall: the numbers are wrong, and nobody can say how wrong or why. Teams then clean data in Excel, in Power BI or in a transformation script, and the same errors return next month. This guide from Devies, a Gothenburg-based product and engineering consultancy, is for data leads, controllers and system owners who want data quality (datakvalitet) to be measured and owned rather than argued about.
What is data quality?
Data quality is the degree to which data is fit for a specific use. The same customer table can be good enough for a marketing newsletter and too poor for invoicing, so quality is always judged against a purpose and a threshold.
The international standard ISO/IEC 25012 defines a data quality model with fifteen characteristics, split into inherent ones, such as accuracy, completeness and consistency, and system-dependent ones, such as availability and recoverability. In practice most teams work with a shorter list of data quality dimensions they can test automatically.
Dimension
Question it answers
Example rule
Completeness
Question it answers
Are required values present?
Example rule
Every active customer has an organisation number
Validity
Question it answers
Do values follow the agreed format and range?
Example rule
Postal codes have five digits; discount is between 0 and 100 percent
Uniqueness
Question it answers
Is each real-world thing recorded once?
Example rule
No two customer records share an organisation number
Consistency
Question it answers
Do related values agree across tables and systems?
Example rule
Order total equals the sum of order lines
Timeliness
Question it answers
Is the data recent enough for its use?
Example rule
Sales data is no more than 24 hours old at 07:00
Accuracy
Question it answers
Does the value match reality?
Example rule
Sampled addresses match the official register
Accuracy is the hardest to automate because it needs a trusted reference. The others can be written as rules and run every time data loads.
Why does fixing data in reports not work?
Fixing data downstream treats the symptom and hides the cause. When a report corrects a misspelt product code or excludes duplicate customers, the source system keeps producing the error, every other consumer repeats the fix in a slightly different way, and the totals start to diverge.
Quality problems almost always start in one of four places: a form that allows free text where a choice list belongs, an integration that maps fields wrongly, a process where nobody is responsible for keeping a record current, or a business rule that changed without the data changing with it. Each needs a fix in the system or process, which is why data quality is as much an ownership question as a technical one. Clear owners and stewards, as described in our guide to data governance without the bureaucracy, are a precondition.
Seven steps to measure and fix data quality
The method below starts small, makes quality visible and moves fixes upstream. Run it on one domain, such as customers or products, before expanding.
- Pick the data that hurts. Choose one domain and the reports or processes that depend on it. List the complaints: wrong totals, returned invoices, duplicate customers, failed deliveries.
- Name an owner. A business owner decides what "good enough" means; a data steward maintains the rules. Without them, the following steps produce dashboards nobody acts on.
- Write rules per dimension. Turn each complaint into a testable rule with a threshold, using the table above. Ten good rules on critical fields beat two hundred generic ones.
- Profile and baseline. Run the rules on current data and record the scores. This is your starting point and the evidence for prioritising fixes.
- Automate the checks in the pipeline. Run rules on every load. Tools such as dbt data tests express checks as queries that return failing rows, with built-in tests for unique, not null, accepted values and relationships, and source freshness checks cover timeliness. Decide per rule whether a failure warns or stops the load. Our guide to data pipelines that do not break covers where to place them.
- Fix at the source. For each failing rule, find where the error enters: the form, the integration, the process. Change validation, choice lists, mappings or responsibilities there, and clean historical records once.
- Publish scores and review monthly. Show quality per domain next to the reports that use it, and let the owner review trends and open issues once a month.
Devies saw this approach pay off at Gothenburg's Stadsbyggnadsförvaltningen, where traffic data arrived from sensors and suppliers in different formats and quality levels. A unified data model, stable pipelines, automated quality checks and anomaly detection now flag issues before they reach planners, data quality status is visible in the platform, and the case estimates 400 hours a year saved in manual data validation.
How do you choose what to fix first?
Fix first where poor quality costs the most and the source fix is cheapest. A simple scoring of impact and effort is usually enough.
- High impact, low effort: a missing validation on a form, a wrong mapping in one integration. Fix this week.
- High impact, high effort: duplicate customers across several systems. This often needs master data management and a project of its own.
- Low impact, low effort: formatting issues in rarely used fields. Batch them.
- Low impact, high effort: leave them, and record the decision.
Measure the impact in business terms where you can: invoices returned, orders delayed, hours spent on manual checks. These numbers are what earn the budget for source fixes.
How do you keep data quality from slipping back?
Quality stays high when checks run automatically, owners see the scores and changes to source systems are reviewed for data effects. Three habits make the difference:
- Treat rule failures like bugs. They get a ticket, an owner and a due date, not a comment in a chat.
- Review data effects of system changes. When a form, an integration or a process changes, the data steward checks which rules and reports are affected.
- Extend rules when new uses appear. An AI assistant or a new KPI often needs stricter thresholds than existing reports.
Data quality work is never finished, but it can become routine. The aim is not perfect data; it is data whose quality is known, measured and good enough for each use.
Keep reading
From our work
 Client Case: Stena LineStena Line modernised its Azure data platform - improving Power BI reliability, reducing pipeline runtimes and scaling with medallion architecture.Read the case
Devies
Want a second opinion?
Devies, a Gothenburg-based product and engineering consultancy, works on questions like this with Nordic product and IT teams. Tell us where you are and we will suggest a sensible first step.
Frequently asked questions
What are the main dimensions of data quality?
The most used dimensions are completeness, validity, uniqueness, consistency, timeliness and accuracy. Completeness asks whether required values exist, validity whether they follow agreed formats, uniqueness whether each thing is recorded once, consistency whether related values agree, timeliness whether data is recent enough and accuracy whether it matches reality. ISO/IEC 25012 defines a longer list of fifteen characteristics for formal work.
How do you measure data quality?
Write each expectation as a testable rule with a threshold, for example "every active customer has an organisation number". Run the rules automatically on each data load and calculate the share of records that pass. Track the score per rule, table and domain over time. The score only means something when a business owner has agreed what level is good enough for the intended use.
Who is responsible for data quality?
The business owns data quality, because only the business can decide what correct and good enough mean. In practice a data owner sets the requirements, a data steward maintains rules and follows up issues, and the data or IT team builds the automated checks. When quality is left to the data team alone, errors get patched in reports instead of fixed in the source.
Which tools are used for data quality checks?
Many teams start with checks in their transformation tool, such as dbt data tests, or the quality features in their data platform. Dedicated data observability and data quality tools add anomaly detection, lineage and alerting across many sources. The tool matters less than the rules: agreed, testable expectations on critical data, owned by someone who acts on failures.