What predictive analytics is, how a forecast is built and tested, where it pays off for mid-sized companies, and when it is the wrong tool.
In short
Predictive analytics is the use of historical data and statistical or machine learning models to estimate what is likely to happen next, such as demand, churn or late payments. It works when the past resembles the future, enough history exists and the forecast changes a decision. Test it on data the model has not seen, and compare it with a simple baseline.
Reports tell you what happened last month. Leaders usually want to know what will happen next month, and what to do about it. This explainer from Devies, a Gothenburg-based product and engineering consultancy, is for CFOs, operations managers and data leads who want to understand predictive analytics (prediktiv analys) well enough to judge a proposal, ask the right questions and avoid forecasts that look precise but are not.
What is predictive analytics?
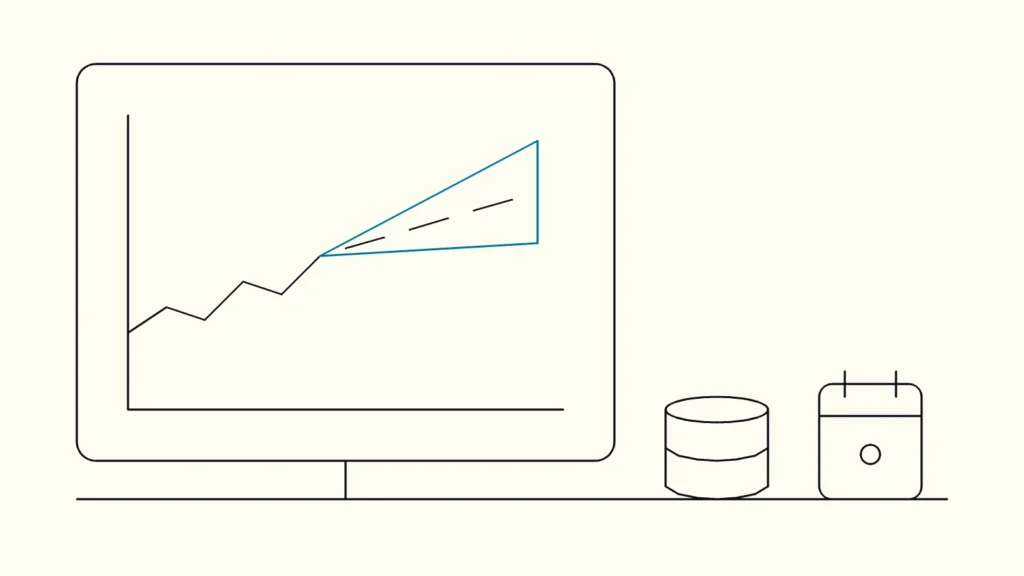
Predictive analytics is the practice of using patterns in historical data to estimate a future value or the probability of a future event. The output is a number with uncertainty, for example "expected demand next week is 1,200 units, likely between 1,050 and 1,350", or a score, for example "this customer has a 30 percent chance of cancelling within 90 days".
Two kinds of prediction cover most business cases:
- Forecasting estimates a quantity over time: sales, stock, cash flow, call volumes or energy use.
- Classification and scoring estimate the probability that something belongs to a category: a customer who will churn, an invoice that will be paid late, a machine part that will fail.
Google's machine learning course describes the same split: a regression model "predicts a numeric value", while a classification model predicts the likelihood that something belongs to a category (Google for Developers).
How does predictive analytics differ from BI, AI and machine learning?
Predictive analytics is one type of analysis, defined by its question (what is likely to happen?), while machine learning is one family of methods it can use, and AI is the much wider field around both.
Term
Question it answers
Typical output
Example
Descriptive analytics (BI)
Question it answers
What happened?
Typical output
Reports, dashboards
Example
Sales per region last quarter
Diagnostic analytics
Question it answers
Why did it happen?
Typical output
Drill-downs, root-cause analysis
Example
Which product drove the drop
Predictive analytics
Question it answers
What is likely to happen?
Typical output
Forecasts, probability scores
Example
Demand next month, churn risk
Prescriptive analytics
Question it answers
What should we do?
Typical output
Recommendations, optimised plans
Example
How much to order per warehouse
Machine learning
Question it answers
How can a model learn patterns from data?
Typical output
A trained model
Example
A gradient-boosted churn model
Generative AI
Question it answers
How can a model create text, images or code?
Typical output
New content
Example
A drafted customer email
Many useful forecasts need no machine learning at all. Seasonal statistical models often beat complex ones on short, regular sales series. Our explainer on machine learning for business leaders covers when the more flexible methods are worth it.
How is a predictive model built and tested?
A predictive model is built by learning from historical examples where the outcome is known, then tested on a later period the model never saw, so the test mimics using it on the real future.
- Define the decision and the target. "Reduce stock-outs" becomes "forecast weekly units per product and warehouse, four weeks ahead". The horizon and granularity follow from the decision.
- Collect history and drivers. Past outcomes plus factors that may explain them: prices, campaigns, holidays, weather, contract dates.
- Build a baseline. Use a naive forecast, such as "same week last year" or "average of the last four weeks". If a model cannot beat this, it is not worth running.
- Train candidate models. From seasonal statistical models to machine learning, depending on data volume and complexity.
- Test on the future, not on a random sample. For time series, splitting data randomly leaks the future into training. The scikit-learn documentation explains that ordinary cross-validation is inappropriate for time-ordered data because it would lead to training on future data and evaluating on past data; use time-based splits instead.
- Measure error in business terms. Report error in units, kronor or missed cases, alongside the uncertainty range, not just a technical score.
- Put it into the workflow. A forecast in a notebook changes nothing. It must reach the planning tool, report or system where the decision is made, and be monitored as conditions change.
When do predictions work, and when do they fail?
It works when the drivers are understood, enough relevant history exists, the future resembles the past and the forecast does not change the thing it predicts. Those are the four factors the forecasting textbook by Hyndman and Athanasopoulos lists in Forecasting: Principles and Practice, and they are a useful checklist before any project.
Good fits for mid-sized companies:
- Demand and stock planning for products with steady sales history.
- Cash flow and late payments, using invoice and payment history.
- Customer churn in subscription or contract businesses.
- Staffing, such as support calls or warehouse workload per day.
- Maintenance, where sensor and service data cover enough failures.
Poor fits:
- Brand-new products or markets with no relevant history.
- Rare events with only a handful of past examples.
- Shifts in the rules, such as a pandemic, a new competitor or a regulatory change, which break the link between past and future.
- Self-defeating forecasts, where acting on the prediction changes the outcome, for instance a stock-out forecast that triggers panic buying.
Data quality matters more than model choice. Missing dates, changed product codes and duplicated customers ruin forecasts quietly. Our guide on measuring and fixing data quality at the source is a practical starting point, and the AI readiness checklist helps you judge one use case before you invest.
What does it take to run forecasts in production?
Running it in production takes a reliable data pipeline, an owner for each forecast, monitoring of accuracy over time and a routine for retraining when the world changes.
A forecast that was accurate last year can drift as customers, prices and suppliers change. Track forecast error every period, set a threshold that triggers investigation, and keep the baseline running alongside the model so you can see whether the model still earns its place. Store each forecast with the data and model version that produced it, so you can explain a past decision.
Be careful with predictions about people. A score that affects whether someone gets credit, a job or a service can fall under the GDPR's rules on automated decisions and, for some uses, the EU AI Act's high-risk rules. Keep a person in the loop for such decisions and document how the score is used.
Keep reading
From our work
 Client Case: Stena LineStena Line modernised its Azure data platform - improving Power BI reliability, reducing pipeline runtimes and scaling with medallion architecture.Read the case
Devies
Want a second opinion?
Devies, a Gothenburg-based product and engineering consultancy, works on questions like this with Nordic product and IT teams. Tell us where you are and we will suggest a sensible first step.
Frequently asked questions
What is the difference between predictive analytics and forecasting?
Forecasting is a part of predictive analytics. It estimates a quantity over time, such as sales next month or calls per day. Predictive analytics also covers classification and scoring, such as the probability that a customer will churn or an invoice will be paid late. Both rely on historical data and should be tested on a later period the model has not seen.
How much historical data do you need for predictive analytics?
It depends on the pattern you need to capture. To model yearly seasonality you need at least two to three years of history, ideally more. For churn or late-payment scoring you need enough past cases of the outcome, often hundreds rather than dozens. If history is short or the business has changed fundamentally, start with simple baselines and expert judgement.
Do we need machine learning for predictive analytics?
Not always. Simple statistical forecasting methods often perform as well as or better than machine learning on short, regular time series such as monthly sales. Machine learning helps when many drivers interact, when there is a lot of data, or for scoring individual customers or assets. Always compare any model with a naive baseline before choosing the more complex option.
How accurate can a forecast be?
Accuracy depends on how predictable the quantity is, not only on the model. Stable, high-volume products can be forecast closely; new products and rare events cannot. A good forecast states its uncertainty as a range and is judged against a simple baseline on data it has not seen. Treat any promise of a fixed accuracy before testing with suspicion.